science · Grade 11 · Physics
Read Velocity Data
Calculate and interpret acceleration from a velocity table.
Find this activity in the Science map
Explore the knowledge outline and its source scope. This unit supports selected ideas.
Learning goals
- Calculate and interpret acceleration from a velocity table.
Before you begin
Understand the words and representations introduced in the Explore activity.
Age and grade do not measure readiness. Adjust reading or adult support to preserve the intended learning goal.
Follow the sequence
Complete practice
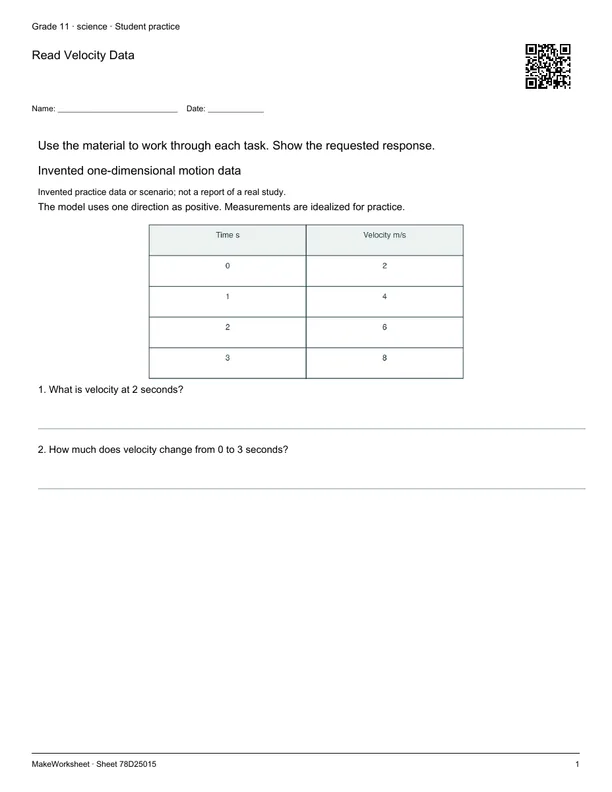 Practice preview
Read Velocity Data
Practice · Independent · 25 min
Calculate and interpret acceleration from a velocity table. A complete set with exploration, practice and application. Use the linked unit for the learning sequence and teaching guide.
1. Explore
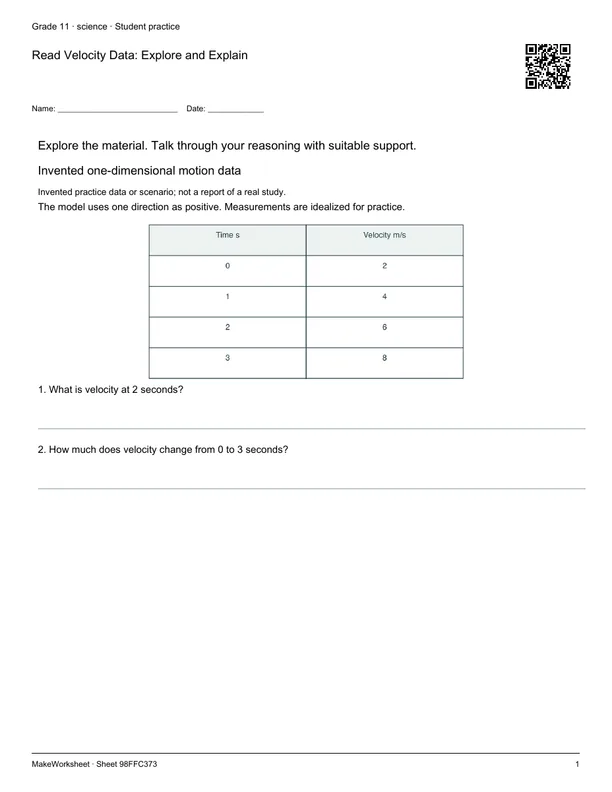 Practice preview
Read Velocity Data: Explore and Explain
Explore · Independent · 10 min
Calculate and interpret acceleration from a velocity table. A focused learn activity. Use the linked unit for the learning sequence and teaching guide.
2. Practice
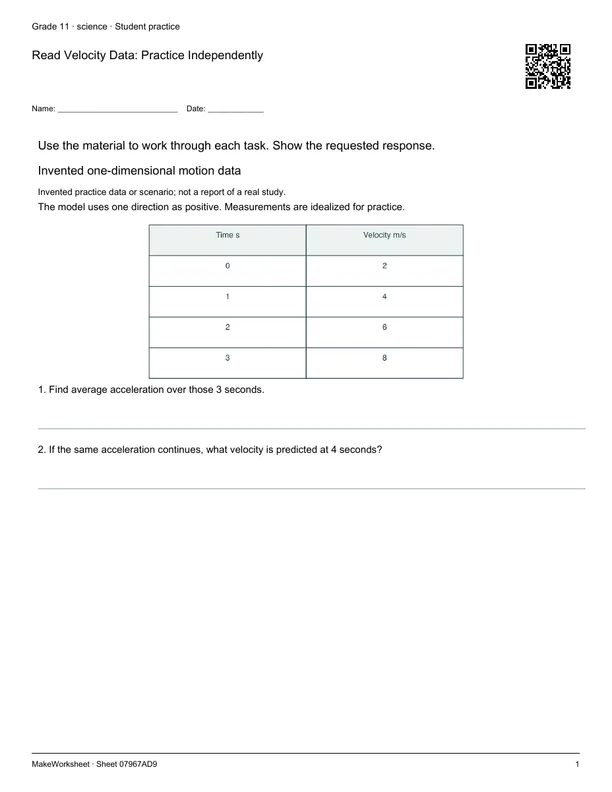 Practice preview
Read Velocity Data: Practice Independently
Practice · Independent · 10 min
Calculate and interpret acceleration from a velocity table. A focused practice activity. Use the linked unit for the learning sequence and teaching guide.
3. Apply
 Practice preview
Read Velocity Data: Apply and Create
Apply · Independent · 15 min
Calculate and interpret acceleration from a velocity table. A focused apply activity. Use the linked unit for the learning sequence and teaching guide.
Download the unit pack
Numbered activities, separate answer keys and a teaching guide in one ZIP. The pack uses the focused sequence; the complete practice sheet above is an alternative.
Teaching and response guide
- Begin with: What is velocity at 2 seconds?
- Connect the response to: Find average acceleration over those 3 seconds.
- Ask students to apply the idea: What does slope in a velocity-time graph represent?
Watch for: Accepting an answer without checking whether it uses the material and satisfies the requested relationship or criteria.
Check the answer criteria for each task. A supported explanation may have more than one acceptable response. These activities offer evidence to discuss; completing a sheet alone does not establish mastery.